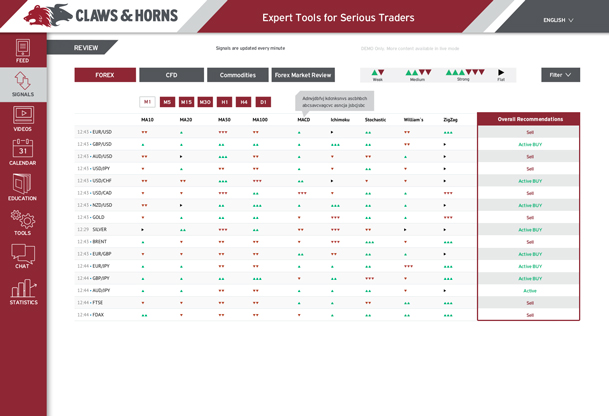
Technical indicators signals

Traders have to switch between charts to monitor current situations, and analyze indicators. It takes a lot of time and effort, and sometimes results in mistakes and doubts. Due to their lack of knowledge, new traders tend to make more emotionally driven decisions which lead to rapid losses of money, which at times results in them disengaging from forex, and a decrease in trading activity is observed.
We analyze the 10 most reliable technical indicators and traders can choose those which best suit their trading strategies. “Market sentiment” is a helpful addition to technical indicators. It shows whether short or long positions prevail on the market.
Timeframe is a period of time used group quotes while outlining a price chart. For example: M30, H1, H4, D1.
Indicators are the accumulation of various trading metrics such as price, trading volumes and others. We use the following indicators: MA10, MA20, MA50, MA100, MACD, Bollinger Bands, Ichimoku, Stochastic, William’s, ZigZag.
Trading tips advise the trading strategies that should be taken based on our comprehensive analysis of indicators.
Period is a tool used to choose a timeframe during which historical data is displayed.
Trading instruments are market assets; when their prices change, trade transactions are performed. We analyze the following trading assets: EUR/USD, GBP/USD, AUD/USD, USD/JPY, USD/CHF, USD/CAD, NZD/USD, Gold, Silver, BRENT, EUR/GBP, EUR/JPY, GBP/JPY, AUD/JPY.
Market Sentiment indicates the percentage of long and short positions opened in various trading instruments.
Volatility record is historical data on the price fluctuation rate of a financial instrument over various time periods.
Range sets the number of weeks during which data is displayed.
